Welcome to my portfolio. Here you will find a selection of my work as a student of geoinformatics.
Network analysis on the effects of road cuts caused by a volcanic eruption
The poster below summarises the results from my final project for the elective course Spatial Data Analysis. My goal was to understand the changes in travel time to the hospital caused by the road cuts resulting from the 2021 Cumbre Vieja eruption in La Palma (Canary Islands).
I processed the data and performed the network analysis (time-based) in QGIS 3.28, using the plugin QNEAT3.
Other than network analysis itself, this project involved extensive work on vector data wrangling, subsetting, merging, harmonising and detecting and fixing topology errors.
Geothermal Energy in Queensland, Australia
This map was part of the final project of the course 'Geospatial Analysis with Python and R' at the University of Tartu. The objective was to understand the distribution of exploration permits for geothermal energy in Queensland. To this end, I plotted exploration permits with the location of cities and an approximate geothermal gradient, interpolated from well data.
I used R 4.3.1 with packages Tidyverse, Sf, Gstat, Sp, Terra, Grid and Tmap for all the data manipulation and plotting.
Contains modified data from:
© State of Queensland (Department of Resources) 2023
© Commonwealth of Australia (Geoscience Australia) 2016
Exploration for Minerals, Coal and Petroleum in Queensland, Australia
This interactive map was part of the final project of the course 'Geospatial Analysis with Python and R' at the University of Tartu. The objective was to visualise patterns in the distribution of exploration permits for minerals, coal and petroleum in relation to the geological framework.
I manipulated the data and created the map with Python 3.10.12 in Jupyter Notebook, employing Numpy, Pandas, Geopandas, Matplotlib, Shapely and Folium.
Data from © State of Queensland (Department of Resources) 2023
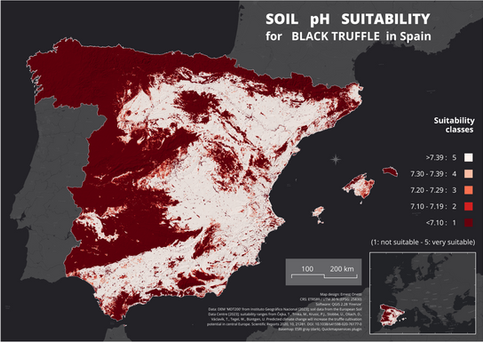
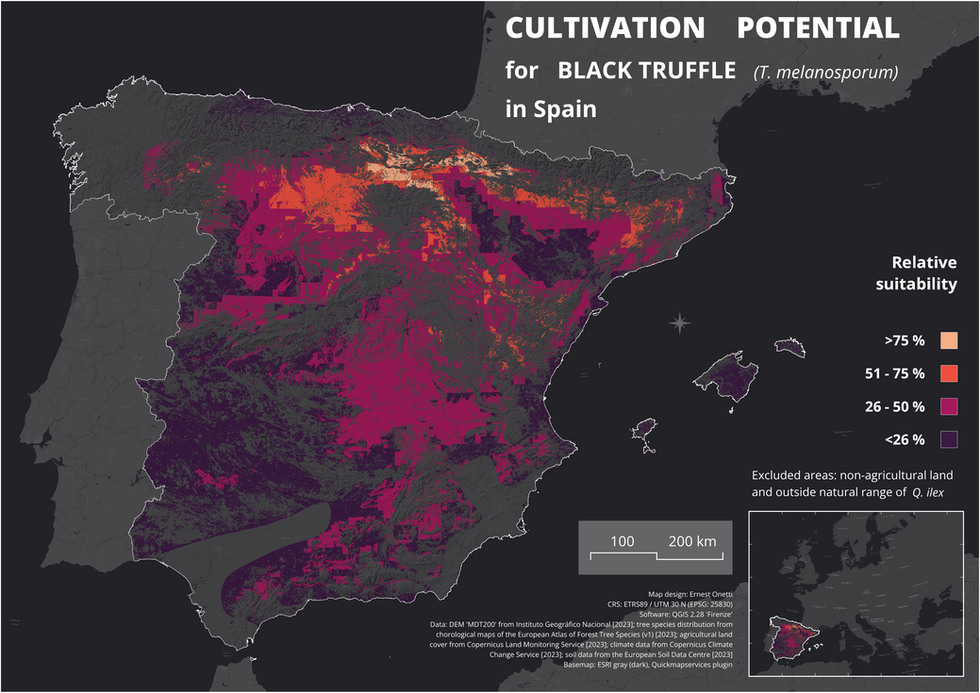
Suitability for Black Truffle Cultivation across Spain
Truffles are soil fungi that grow in symbiosis with the roots of some forest trees. They are sensitive to climate, elevation and soil properties like pH. Here is a selection of the maps that I elaborated for the final project of the course 'Spatial Data Studio'. The goal was to create a country-wide dataset about the suitability for black truffle (Tuber melanosporum) cultivation and identify the provinces with higher potential.
The whole project was carried out with QGIS 3.28.11 and involved the combination of data from different source formats, spatial resolutions and CRS.
Hydrological Model of Lleida Province, Catalonia,
Spain
In the course 'Spatial Data Studio' I was introduced to some applications of WhiteboxTools Open Core. I employed this software package in QGIS 3.28.11 to build a realistic model of Lleida's river network from only elevation data.
Soil Susceptibility to Erosion in Lleida Province,
Catalonia,
Spain
The loss of agricultural soils is one of our most pressing environmental concerns. I created this map of soil erodability (left) with QGIS 3.28.11 during the course 'Spatial Data Studio'. It combines information from three raster layers: slope (top right), derived from a digital elevation model, soil texture (bottom right) and land cover.
Vegetation and Land Cover around Barcelona,
Catalonia,
Spain
The maps below were the output of a practical session after an introduction to remote sensing in the course 'Spatial Data Studio'. I built them in QGIS 3.28.11, using the Semi-Automatic Classification Plugin for certain tasks.
After experimenting with land cover classification techniques and ways to go about it, I concluded that a supervised classification with fewer, clearly discernible classes offered the best performance to me. In the resulting classified map (bottom) most forested areas and different forest types were correctly identified, even if crops and urban areas were classed together.
While I have gained insights about remote sensing in other courses and in different contexts, there is a lot to learn and I am eager to carry on.


